Introduction to South Africa
< previous topic: South Africa’s Political System
Geography
Physical map of South Africa (source: ezilon)
South Africa has a land area of 1,219,912 km2 (471,011 sq mi), making it the 25th largest country in the world in terms of land area. The country occupies the southern tip of the African continent, stretching from 22°S to 35°S latitude and from 17°E to 33°E longitude.
South Africa borders Namibia, Botswana, Zimbabwe, Mozambique, Swaziland and entirely surrounds the landlocked Kingdom of Lesotho. South Africa’s border with Namibia is formed by the Orange River which cuts through the Namib Desert; the Limpopo River in the east forms the border with Zimbabwe and part of the border with Botswana while the Molopo River forms another part of the border with Botswana
It is bordered to the west by the Atlantic Ocean and to the south and southeast by the Indian Ocean. The Cape of Good Hope, located in South Africa, is not actually the southernmost point in Africa or the dividing point between the Atlantic and Indian oceans – Cape Agulhas, 150km east-southeast, is the southernmost point in Africa.
South Africa is largely covered by a high plateau in the interior, surrounded by a narrow strip of coastal lowlands. The lowlands are separated from the interior of the plateau by the Great Escarpment, a mountainous region which includes South Africa’s highest peaks (at 2-3,300m) and which more or less paralleling the entire western, southern and eastern coastline of the country. The Drakensberg, in the ‘mountain kingdom’ of Lesotho and the South African provinces of Eastern Cape and KwaZulu-Natal (KZN), is southern Africa’s highest mountain range with peaks exceeding 3,300 metres.
The interior plateau is a mix of different regions and ecosystems. In the west, much of the Northern Cape (NC) province is covered by arid desert and includes South Africa’s driest regions. The Southern Namib Desert, along the Atlantic coastline from the Namibian border, and the Kalahari Desert, bordering Botswana and Namibia, are both dry and sparsely populated regions. The two deserts are separated by the Cape Middleveld subregion, an arid expanse of undulating plains characterized by large depressions.
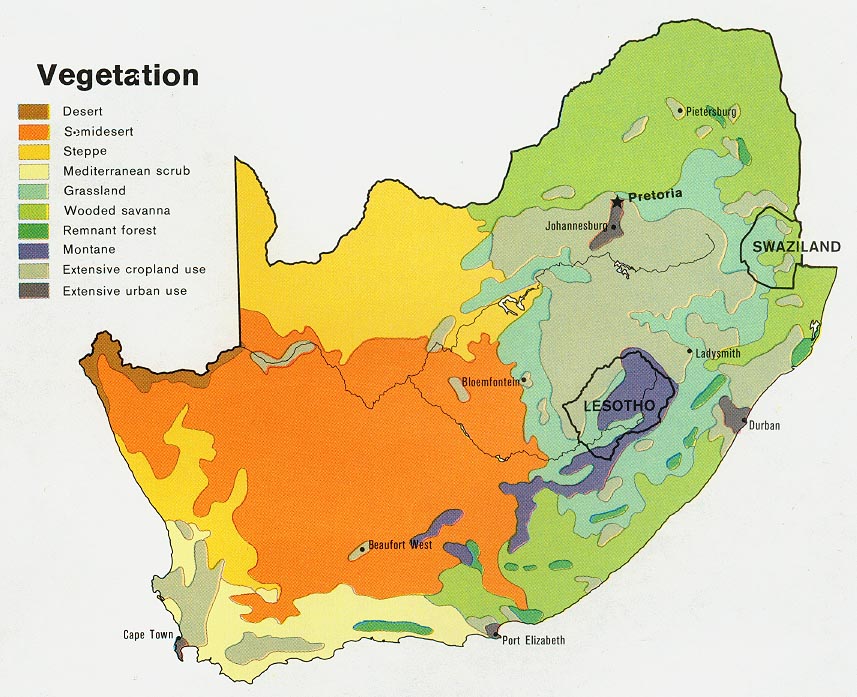
Vegetation in South Africa (source: Perry-Castañeda Library Map Collection)
The rest of the plateau mostly consists of rolling grasslands, called veld in Afrikaans, of which the largest is the Highveld, which covers the entirety of the Free State and parts of Gauteng, North West, Northern Cape and Mpumalanga provinces. In Gauteng, the Highveld rises into a sedimentary rock formation known as the Witwatersrand (colloquially known as the Rand). The Rand is a ridge of gold-bearing rock, site of the world’s largest gold deposits and South Africa’s largest conurbation, sometimes referred to as Pretoria-Witwatersrand-Vereeniging (PWV).
Northern South Africa – the Limpopo province and parts of North West, Gauteng and Mpumalanga provinces – is covered by the Bushveld, a dry savannah region which lies at lower elevations (600-900m) than the Highveld (1,200-1,8000m). Although less industrialized and urbanized than the Rand, the Bushveld is a mineral-rich region with significant deposits of platinum, chromium and other minerals. The Bushveld is separated from the Lowveld, in the Limpopo River valley, by mountain ranges part of the Great Escarpment. Kruger National Park, a renowned game reserve, is located in the Lowveld along the Mozambican border.
In the Western Cape and parts of the Eastern Cape provinces, the Cape Ranges, a mountain range formed by the folding of the continental crust, separates the coastal areas from the arid interior. Peaks in this region exceed 2,000 metres and are the second-highest peaks in the country outside the Drakensberg. The semidesert Karoo region, located in the Western Cape, Eastern Cape and Northern Cape provinces, separates the Cape Ranges from the Highveld.
Population and Society
In the 2011 Census, South Africa had an official population of 51,770,560 and Statistics South Africa estimated the population to be 52,982,000 in May 2013.
| Province | Population (2011) | % of nat’l pop. |
| Gauteng | 12,272,263 | 23.7% |
| KwaZulu-Natal | 10,267,300 | 19.8% |
| Eastern Cape | 6,562,053 | 12.7% |
| Western Cape | 5,822,734 | 11.2% |
| Limpopo | 5,404,868 | 10.4% |
| Mpumalanga | 4,039,939 | 7.8% |
| North West | 3,509,953 | 6.8% |
| Free State | 2,745,590 | 5.3% |
| Northern Cape | 1,145,861 | 2.2% |
South Africa’s population is unevenly distributed, a result of geography, economics and history. The eastern half of the country, especially the arid and largely semi-desertic Northern Cape (NC) province, has a small population concentrated in urban centres along the coast (Cape Town, George, Knysna, Port Elizabeth), inland areas with a temperate climate (Paarl, Stellenbosch), inland cities along rivers (Upington, NC along the Orange River) or inland economic centres (Kimberley, NC and its diamond mines).

Population density of South Africa by electoral ward, right (source: Wikipedia)
Western South Africa is more densely populated, with Gauteng province – home to the Rand and the PWV conurbation – being the most populated province in South Africa, overtaking KZN shortly after 2001. Gauteng, as the economic centre of the country, has attracted a large population for hundreds of years, often voluntary or involuntary labour migrants from the rural areas of the country, and, in recent years, a large immigrant population from Africa’s poorer countries (Zimbabwe especially) drawn to South Africa. In 2011, 7% of Gauteng’s residents were not RSA citizens. Other major urban centres, such as Cape Town (WC) and Durban (KZN), are also densely populated.
However, if South Africa’s population is increasingly concentrated in urban areas (62% in 2011), there remains a large population which lives outside of the main urban centres and in rural areas. The map to the left shows densely populated (darker orange/red on the map) areas in the eastern half of Eastern Cape province, most of KZN, a thin stretch in Mpumalanga and large swathes of Limpopo province. These very densely populated areas in fairly rural and unindustrialised areas is a lingering legacy of centuries of racial discrimination and segregation. These areas coincide almost perfectly with the former Native Reserves and apartheid-era homelands/Bantustans which were intended to segregate South Africa’s black population from ‘whites-only’ urban areas. In the Eastern Cape, the darker orange and red on the map trace the boundaries of the former Transkei and Ciskei homelands; in Mpumalanga, the densely populated areas coincide with the former homelands of KwaNgwane, Gazankulu, KwaNdebele and Lebowa – likewise in Limpopo.
South Africa’s population is young by international standards – the median age is only 25 and 39% of the population in 2011 was under the age of 20. Compared to the rest of Africa or sub-Saharan Africa, however, South Africa’s population is older and is growing less rapidly – a sign of a still-expanding population, but one which has nearly stabilized. In the 1996 Census, for example, the median age was 22. Population Pyramid.com allows you to visualize South Africa’s past, present and future population pyramids from 1950 to 2011. In 1950, South Africa’s population pyramid had a huge youth bulge, sign of a growing population. Back then, only 0.1% or so was older than 80; in 2011, 1.1% of the population was older than 80. However, South Africa has had trouble increasing its life expectancy, which actually dropped from 61.5 in 1990 to 51 in 2006-2007 (it has since increased), a good part of it due to the HIV/AIDS epidemic in the country. The result is that while South Africa’s life expectancy was above the sub-Saharan African average for decades, it is now below the sub-Saharan African average.
Despite general improvements in standards of living and household services since 1994, South Africa remains a developing country with high levels of poverty and persistent social challenges. In 2009, according to the World Bank, 31% of the population lived on less than $2 a day, which is very high compared to Europe, North America and even most of Latin America but low by sub-Saharan African standards – only oil-rich Gabon ranks lower. In 2013, South Africa placed 121st on the Human Development Index (HDI) with a value of 0.63, which places it in the ‘medium HDI’ category; alongside countries such as Indonesia and Botswana, below Egypt, Thailand, Botswana but ahead of Morocco, Iraq and Guatemala. South Africa’s HDI has increased from 0.56 in 1980 but declined from 0.67 in 2006.
The 2011 Census showed that while South Africa still faces major challenges, many of which stem from centuries of segregation and discrimination, there have been improvements in the livelihoods of most South Africans since the end of apartheid. The table below shows selected indicators on education, housing, energy and household goods/services from the 2011 and 1996 Censuses, for the entire country and all racial groups.
| Indicator | 2011 | 1996 |
| No schooling (20+) | 8.6% | 19.1% |
| Grade 12/Std 10 (20+) | 16.3% | 28.9% |
| Average annual household income | R103,204 (US$9,640) | R48,385 (2001) (US$4,548) |
| Formal dwellings | 77.6% | 65.1% |
| Informal dwellings (shacks) | 13.6% | 16.2% |
| Piped water in dwelling or yard | 73.4% | 60.8% |
| No access to piped water | 8.8% | 19.7% |
| Flush toilet connected to sewerage system | 57% | 49.1% |
| Electricity used for lighting | 84.7% | 58.2% |
| Electricity used for cooking | 73.9% | 47.5% |
| Refuse removal by local authority weekly or more | 62.1% | 52.1% |
| Cellphones | 88.9% | 31.9% (2001) |
| Fridge | 68.4% | 49.9% (2001) |
Source: Statistics South Africa / Census 2011
There are regional disparities in poverty and access to basic household necessities and services. From a provincial standpoint, the provinces of Gauteng (Johannesburg, Pretoria) and Western Cape (Cape Town) often stand out as the most developed provinces. For example, 10.4% and 12.6% of those provinces’ population have no schooling or a highest level of education less than Grade 7, compared to 19.1% in South Africa and over 25% in more rural provinces such as the North West, Northern Cape and Limpopo. These two provinces also have, by far, the two highest levels of average annual household income – at R156,243 and R143,460 respectively. The provinces of Limpopo (R56,844) and Eastern Cape (R64,539) had the lowest incomes.
South Africa has made strides in the provision of electricity, piped water and refuse removal but there remains some striking regional differences. Access to electricity is more evenly distributed between the provinces and municipalities than in 1996, with provinces such Eastern Cape moving from 32.2% of households with access to electricity for lighting in 1996 to 75% in 2011. In 1996, for example, less than 10% of households in most of the former apartheid-era homelands, such as the Transkei in EC had access to electricity; in 2011, many areas of the old Transkei, for example, had over 70% of households with electricity. However, access to piped water remains unequally distributed. Eastern Cape, in 2011, still had 22% of households with no access to piped water – the remote, densely populated and fairly mountainous/hilly regions of the Transkei have numerous municipalities with less than 20%, even 10%, of households having access to piped water. For comparison, 87% and 92% of households in Cape Town and Johannesburg have access to piped water. Similarly, remote areas of the Eastern Cape, KZN, Limpopo, Mpumalanga and North West lack access to weekly refuse removal by local governments.

Homicide rates in the RSA since 1995 (source: UNODC, own graph)
South Africa is often painted as one of the world’s most violent countries. Indeed, in the UNODC’s latest report, South Africa’s homicide rate was 30.9/100,000 inhabitants, which places it about fifteenth in the world (but below some other African countries such as the Ivory Coast, Zambia, Uganda and Malawi). The South African Police Service (SAPS)’s 2012/2013 crime statistics reported a 31.1 murder rate and a total of 16,259 murders between April 2012 and March 2013. This was up 4.2% on the previous year (2011/2012). However, it is important to note that the murder rate has been cut very significantly since the end of apartheid. In 1995, the homicide rate was 64.9. According to the SAPS, the number of murders has fallen by 18% since 2003/2004 when there were 19,824 murders and an homicide rate of 42.7.
The SAPS claims that almost all types of crime have fallen since 2003/2004, with the notable exception of robberies, commercial crime and drug-related crimes. The accuracy of some of the SAPS’ statistics, however, have been questioned. In 2012/2013, the most common crimes according to the SAPS were other forms of theft (362,816, 694.1), burglaries in residential premises (262,113 or 501.4/1000,000; up 6.8% on the previous year), drug-related crimes (206,825, 395.6, up 17%) assault with intent to cause harm (185,893, 355.6), and common assault (172,909, 330.8). There is a common perception, both in the country and abroad, that carjacking (vehicle hijacking) is common in South Africa. It is hard to compare with other countries, but in 2012/2013, the SAPS reported 9,990 carjackings and 943 truck hijackings; about 19.1 carjackings per 100,000 inhabitants.
South Africa is tragically notorious for the very high rates of sexual violence. The SAPS’s 2012/2013 crime statistics reported 66,387 total sexual offences (including rape and sexual assault), up 2.9% on the previous year. This represents 127 reported cases of sexual offences per 100,000 inhabitants, one of the highest (if not the highest in the world). The ratio has dropped from 142.5 in 2003/2004 to about 127 in the last two years, but the actual number of sexual offences have largely remained static. However, the accuracy of the SAPS’ statistics on sexual offences is doubtful at best. Independent studies have suggested that the actual number of rapes may be much higher and it is generally agreed that many victims do not report the crime to the police. For example, in a 2009 survey in KZN and EC, 25% of men admitted to having raped someone. A similar study in Gauteng, in 2010, found that 25% of women questioned said that they had been raped in the course of their lifetime. The offender is often-times a relative, close family member, known person in the community or even a figure of authority (police personnel, teachers etc).
The RSA is said to have some of the highest incidences of child and infant rape in the world, with children and even newborn infants being the victims of thousands of rapes in the past decade. A significant contributing factor is the widespread so-called ‘virgin cleansing myth’, which purports that an HIV/AIDS-positive male can be cured if they have sex with a virgin. Many of the child abusers tend to be relatives, guardians or even fathers. Lesbians are often victims of “corrective rape”, which is believed to ‘convert’ them to heterosexuality. Eudy Simelane, a LGBT activist and player on South Africa’s women’s football team was gang raped, beaten, stabbed and murdered in 2008. Despite a very progressive Bill of Rights and stringent legislation on sexual offences (the Criminal Law (Sexual Offences and Related Matters) Amendment Act, 2007), traditional patriarchal societal attitudes remain prevalent.
Many, if not most, cases of rape or sexual assault are not reported the police. A number of studies have shown that victims report only a minority of the cases to the SAPS. The main reasons tend to be fear of reprisal, embarrassment, lack of faith in the police and a feeling that the offender will not be found or sentenced. Some of these attitudes are justified by numerous reports of police incompetence, widespread corruption in the SAPS, police insensitivity and even a high number of SAPS officers arrested for sexual offences including rape (in 2012, 12 SAPS officers were arrested on charges of rape in the WC). Additionally, the National Prosecuting Authority (NPA) has notoriously bungled a number of cases in recent years, undermining the NPA’s credibility. Many rape cases do not lead to a conviction.
A number of disgusting and tragic cases shocked the South African conscience and made international headlines in 2013. Anene Booysen, a 17-year old girl, was gang raped and later died in February 2013. In October, two toddlers were kidnapped, raped and killed in Diepsloot (Gauteng). In November, a six-week old baby was raped by her uncle. A few days before, a 17-year old teenage boy was arrested for the rape, apparently in public, of a four-year old boy. He had previously been accused of raping a 72-year old woman in 2011. These cases, particularly Booysen’s murder and the Diepsloot toddlers, alerted public opinion and led to local angry protests by citizens seeking vigilante justice.
Economy
South Africa is the world’s 25th largest economy and the single largest economy in Africa, with a GDP (PPP) of $595.7 billion in 2013. The country’s economy is rather diversified by African standards, although minerals and natural resources of various kinds (platinum, iron ore, coal, manganese diamonds etc) still form a large share of the country’s exports. South Africa’s main export partners are China (11.8%), the US (8.3%), Japan (6%), Germany (5.7%) and Japan (4.2%).

Industry and mining in South Africa, circa 1979 (source: Perry-Castañeda Library Map Collection)
According to Stats SA’s Q3 2013 GDP report, mining and quarrying contributed 5.2% of the relative size of the GDP. Mining is concentrated in the northern and northwestern provinces – Limpopo, Mpumalaga, North West and Northern Cape provinces, and the Free State to a lesser extent. The largest contributors to the GDP were finance, real estate and business services (21.3%); manufacturing (15.3%) and general government services (13.7%). Agriculture, which has struggled in recent years due to various factors including crime and labour disputes, contributed only 2.2% of the GDP and employed 5% (down from 7.5% in 2003), which is low compared to other countries in Africa.
The manufacturing industry’s contribution to the national economy, due to higher labour costs than in other developing countries and the high cost of transport, communications and general living. The automotive industry is one of the main manufacturing sectors in South Africa, making up about 6-7% of the country’s exports. International auto-makers including BMW, Ford, Volkswagen, GM and Toyota all have production plants in the country, mostly in Gauteng and the Eastern Cape.
Gauteng is South Africa’s economic powerhouse, contributing 34.7% of the economy in 2012. It was followed, in a distant second, by KZN (15.8%) and the Western Cape (14%).
The largest industries in 2013 were services (22.4% of employment), trades (21.4%), finance (13.6%) and manufacturing (11.9%). Employment in manufacturing has dropped from 14.3% in 2003, while service jobs grew to overtake trades as the single largest industry.
The South African economy has faced major challenges in recent years. Compared to other African countries, the South African economy has grown at a very tepid pace and was touched harder by the effects of the initial recession in 2009 than many other African countries. South Africa’s economy is not as dependent on natural resources (such as oil), which has driven the economic boom in countries such as Angola or Zambia in recent years, and it was hurt by low demand for its exports by its main Western trading partners. In 2013, the South African economy grew by 2% according to the IMF (and Stats SA), compared to growth rates of 5.6% in Angola, 6% in Zambia, 7% in Mozambique and even 3.2% in Zimbabwe. This has led to local fears that Nigeria, currently Africa’s third largest economy behind the RSA and Egypt, may overtake South Africa as Africa’s largest economy by the end of the decade.

Official unemployment and absorption rates in South Africa since 2003 (source: Stats SA, own graph)
South Africa has been afflicted by persistently high unemployment rates. Even on a very narrow definition of unemployment which includes only those actively seeking employment, Stats SA reported unemployment at 24.7% of the labour force (15-64) in Q3 2013. Under an expanded definition (including discouraged workers), Stats SA measured unemployment at 35.6%. Only 42% of the labour force had a job, either in the formal or informal sector, a rate significantly lower than in China, Brazil or Indonesia.
Unemployment has been stuck at roughly one quarter of the labour force for over a decade, and it has increased from about 17% in 1995 and 9% in 1980. Compared to other countries which officially report unemployment numbers, South Africa ranks just below Macedonia, Bosnia, Spain and Greece. However, it is worth pointing out that many African countries do not accurately or officially report unemployment, and effective unemployment in countries such as Zimbabwe, Mozambique or Kenya is certainly significantly higher than in South Africa.
Unemployment is huge with younger South Africans, especially poor young blacks. Under the expanded definition of unemployment, Stats SA found that 65% of youths of all races 15 to 25 were unemployed, compared to only 14% of those aged 55 to 64.
A 2006 study said that while the proximate cause of high unemployment was that “prevailing South African wages are too high compared to real wage levels that would clear labor markets at lower levels of unemployment”, the structural cause was the weakness of export-oriented manufacturing since the 1990s; the relative shrinkage of which led to a fall in demand for low-skilled or unskilled labour. In 2013, only 25.6% of employees in all industries were considered skilled, compared to 46.1% who were semi-skilled and 28% who were unskilled. Even in tertiary industries, only 29% were skilled and 43% had less than the Matric (South Africa’s high school graduation exam). Unsurprisingly, Gauteng and the WC led the field for skilled employment.
Besides job creation, the other major economic challenge for South Africa is income inequality. South Africa is one of the world’s most unequal countries in terms of income distribution. On the World Bank’s Gini index, South Africa ranked fourth in the world for income inequality, behind the Seychelles, Comoros and Namibia. The CIA World Factbook’s listing of countries by the Gini index placed South Africa second, behind Lesotho. At any rate, South Africa’s Gini index value is about 0.63, compared to 0.45 for the US, 0.34 for the UK, 0.33 for France and Canada, and 0.28 for Germany. Income inequality has generally increased since the fall of apartheid, with between-race inequalities still high and a rapid increase in intra-race inequality. While some blacks have joined the ranks of an increasingly racially integrated middle-class, many blacks remained mired in poverty.
Undoubtedly, race is inextricably linked to economic and social indicators all cited above. The next section will provide details on South Africa’s racial, ethnic and linguistic groups as well as an analysis of the aforecited economic and social indicators by race.


Leave a comment
Comments 0